College Algebra
Tutorial 40: Graphs of Rational Functions
 Learning Objectives Learning Objectives
After completing this tutorial, you should be able to:
- Find the domain of a rational function.
- Find the vertical asymptote(s) of a rational function.
- Find the horizontal asymptote of a rational function.
- Find the oblique or slant asymptote of a rational
function.
- Graph a rational function.
|
 Introduction Introduction
In this tutorial we will be looking at several aspects
of rational functions. First we will revisit the concept of
domain. On rational functions, we need to be careful that we
don't use values of x that cause our denominator to be zero. If you need a review on
domain, feel free to go to Tutorial 30: Introductions to Functions.
Next, we look at vertical, horizontal and slant asymptotes.
Basically an asymptote is an imaginary line that the curve of
the function
gets very close to or approaches. In the end, we put it all
together and graph rational functions. Sounds like fun, you
better get to it!!! |
 Tutorial Tutorial
The domain is the set of all input values to
which the
rule applies. These are called your independent variables.
These are the values that correspond to the first components of the
ordered
pairs it is associated with.
If you need a review on domain, feel free to go to Tutorial 30: Introductions to Functions.
|
 Example
1 Example
1: Give the domain of the function  .
|
Our restriction here is that the denominator of a
fraction can never
be equal to 0. So to find our domain, we want to set the
denominator
equal to 0 and restrict those values. |
|
*The
den. cannot equal to 0
*Factoring to help "solve"
*1/2 and -3 are restricted values
|
Our domain is all real
numbers except 1/2 and -3, because 1/2 and -3 both make the
denominator equal to 0, which would not give us a real number answer
for our function.
|
In other words, you find the vertical asymptote by
locating where
the function is undefined.
In this case that is where the simplified
rational
function’s denominator is equal to 0.
Some things to note:
You can have zero or many vertical
asymptotes. It
will be x = whatever number(s) cause the denominator to be zero after you have
simplified
the function.
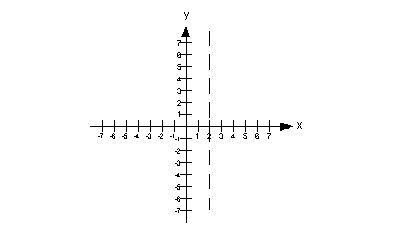
You draw a vertical asymptote on the graph by
putting a
dashed vertical
(up and down) line going through x = a as shown below. This is where the function is undefined, so there
will be NO point on the vertical asymptote itself. The graph will
approach
it from both sides, but never cross over it.
Below is an
example of a vertical asymptote of x = 2:
|
|
 Example 2 Example 2: Find
the vertical asymptote of the function  .
|
|
First we want to check and see if this rational
function
will reduce
down: |
Nothing is able to cancel out, so now we want to
find
where the
denominator is equal to 0: |
|
*Set den = 0
*Set the first factor = 0
*Set the second factor = 0
|
There are two vertical asymptotes: x = -3 and x = 3.
|
 Example 3 Example 3: Find
the vertical asymptote of the function  .
|
First we want to check and see if this rational
function
will reduce
down: |
|
*Factor the function
*Cancel out the common factor
of x + 1
|
Note how the factor x + 1 canceled out, so now
we want to find where the new
denominator is equal to 0:
|
There is one vertical asymptote: x = -2.
|
If there is a
horizontal asymptote, it will fit into one of the two following cases:
Let  be written
in lowest terms, be written
in lowest terms,
Case I
If the degree of P(x)
< the degree of Q(x),
then there is a horizontal asymptote at y = 0 (x-axis).
Case II
If the degree of P(x)
= the degree of Q(x),
then there is a horizontal asymptote at
 . .
In other words, it would be the ratio between the leading
coefficient of the numerator and the leading coefficient of the
denominator.
|
Some things to note:
You may have 0 or 1 horizontal asymptote,
but no
more than that.
The graph may cross the horizontal asymptote, but it levels off and
approaches
it as x goes to infinity.
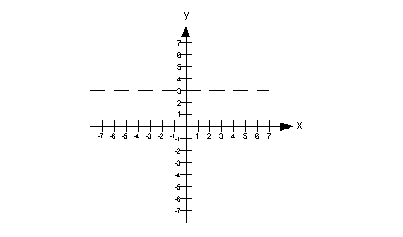
You draw a horizontal asymptote on the graph by
putting
a dashed horizontal
(left and right) line going through y = a.
Below is an
example of a horizontal asymptote of y = 3: |
|
 Example 4 Example 4: Find
the horizontal asymptote of the function  .
|
First we want to check and see if this rational
function
will reduce
down: |
Nothing was able to cancel out, so now we want to
compare the degrees of the numerator and the denominator.
What
is the degree of the numerator? If you said 1, you are
correct. The leading term is 3 x and its degree is 1.
What
is the degree of the denominator? If you said 2, you are
correct. The leading term is  and its
degree is 2.
If you need a review of finding the degree of a polynomial, feel free
to go to Tutorial 6: Polynomials.
Since the degree of the numerator is 1 is less than the degree of the
denominator, then there is a horizontal asymptote at y = 0.
|
 Example 5 Example 5: Find
the horizontal asymptote of the function  .
|
First we want to check and see if this rational
function
will reduce
down: |
|
*Factor the function
*Cancel out the common factor
of x + 1 |
Note how the factor x + 1 canceled out, so now we
want to compare the degrees of the numerator and the denominator that
is left.
What
is the degree of the numerator that is left? If you said
1, you are
correct. The leading term is x and its degree is 1.
What
is the degree of the denominator that is left? If you said
1, you are
correct. The leading term is x and its
degree is 1.
If you need a review of finding the degree of a polynomial, feel free
to go to Tutorial 6: Polynomials.
Since the degree of the numerator is equal to the degree of the
denominator, then there is a horizontal asymptote at
|
Oblique or Slant Asymptote
An oblique
or a slant asymptote is an asymptote
that is neither vertical or horizontal.
If the degree of
the numerator is one more than
the degree of the
denominator, then the graph of
the rational function will have a slant
asymptote.
|
|
Some things to note:
The slant asymptote is the quotient part of the answer you get when you
divide the numerator by the denominator.
If you need a review of long division, feel free to go to Tutorial 36: Long Division.
You may have 0 or 1 slant asymptote,
but no
more than that.
A graph can have both a vertical and a slant asymptote, but it CANNOT
have both a horizontal and slant asymptote.
You draw a slant asymptote on the graph by
putting
a dashed horizontal
(left and right) line going through y = mx + b.
Below is an
example of a slant asymptote of y = x + 1:
|
|
 Example 6 Example 6: Find
the oblique asymptote of the function  .
|
Note that this rational function is already reduced
down.
Applying long
division to this problem we get:
|
The answer to the long division would be  .
The equation for the slant
asymptote is the quotient part of the answer which would be  .
|
Graphing Rational Functions
|
Step 1: Reduce the rational function to lowest terms and check for any open
holes in the graph. |
If any factors are TOTALLY removed from the
denominator, then
there will not be a vertical asymptote through that value, but an open
hole at that point.
If this is the case, plug in the x value that causes that removed factor to be zero into the reduced
rational function. Plot this point as an open hole.
|
Step 2: Find all of the asymptotes and draw them as dashed lines. |
Let  be a rational function
reduced to lowest terms and Q( x)
has a degree of at least 1:
Note that a graph can have both a vertical and a slant asymptote, or
both a vertical and horizontal asymptote, but it CANNOT have both a
horizontal and slant asymptote.
|
Step 3: Determine the symmetry. |
The graph is symmetric about
the y-axis if the function is even.
The graph is symmetric about the origin if the function is odd.
If you need a review of even and odd functions, feel free to go to Tutorial 32: Graphs of Functions Part II.
|
Step 4: Find and plot any intercepts that exist. |
The x-intercept is
where the graph crosses the x-axis.
You can find this by setting y = 0 and solving for x.
The y-intercept is
where the graph crosses the y-axis.
You can find this by setting x = 0 and solving for y.
If you need a review on intercepts, feel free to go to Tutorial 26: Equations of Lines.
|
Step 5: Find and plot several other points on the graph. |
You should have AT LEAST two points in each section of
the graph that is marked off by the vertical asymptotes.
|
Step 6: Draw curves through the points, approaching the asymptotes. |
Note that your graph can cross over a horizontal or
oblique asymptote, but it can NEVER cross over a vertical asymptote.
|
 Example 7 Example 7:
Sketch the graph of the function  .
|
This function cannot be reduced any further. This
means that there will be no open holes on this graph.
|
Vertical Asymptote:
So now
we want to find where the denominator
is equal to 0:
|
There is one vertical asymptote: x = 0.
|
Horizontal Asymptote:
So now we want to
compare the degrees of the numerator and the denominator.
What
is the degree of the numerator? If you said 0, you are
correct. The leading term is the constant -1 and its degree is 0.
What
is the degree of the denominator? If you said 2, you are
correct. The leading term is  and its
degree is 2.
If you need a review of finding the degree of a polynomial, feel free
to go to Tutorial 6: Polynomials.
Since the degree of the numerator is less than the degree of the
denominator, then there is a horizontal asymptote at y = 0.
|
Slant Asymptote:
Since the degree of the numerator is NOT
one degree higher than the degree of the denominator, there is not
slant asymptote.
|
x-intercept:
What value are we going to use for y? You are correct if
you said 0.
|
|
*Plug in 0 for y
*No x-intercept
|
This means there is NO x-intercept.
|
y-intercept:
What value are we going to use for x? You are correct if
you said 0.
|
|
*Plug in 0 for x
*No y-intercept
|
This means there is NO y-intercept.
|
So far we have not found any points to plot on the
graph. Note how the vertical asymptote sections the graph into
two parts. I’m going to plug in two x values that are to the left
of x = 0 and two
that are to the right of x = 0.
|
Plugging in -2 for x we get:
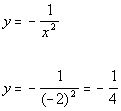 (-2, -1/4)
|
Plugging in -1 for x we get:
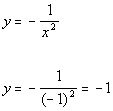 (-1, -1)
|
Plugging in 1 for x we get:
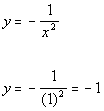 (1, -1)
|
Plugging in 2 for x we get:
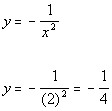 (2, -1/4)
|
Step 6: Draw curves through the points,
approaching the asymptotes. |
 Example 8 Example 8:
Sketch the graph of the function  .
|
This function cannot be reduced any further. This
means that there will be no open holes on this graph.
|
Vertical Asymptote:
So now
we want to find where the denominator
is equal to 0:
|
|
*Set den = 0
*Set the 1st factor = 0
*Set the 2nd factor = 0
|
There are two vertical asymptotes: x = -2 and x = 1.
|
Horizontal Asymptote:
So now we want to
compare the degrees of the numerator and the denominator.
What
is the degree of the numerator? If you said 2, you are
correct. The leading term is  and its degree is
2.
What
is the degree of the denominator? If you said 2, you are
correct. The leading term is  and its degree is
2.
If you need a review of finding the degree of a polynomial, feel free
to go to Tutorial 6: Polynomials.
Since the degree of the
numerator is equal to the degree of the denominator, then there is
a horizontal asymptote at
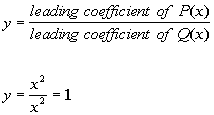
|
Slant Asymptote:
Since the degree of the numerator is NOT
one degree higher than the degree of the denominator, there is not
slant asymptote.
|
x-intercept:
What value are we going to use for y? You are correct if
you said 0.
|
|
*Plug in 0 for y
*Mult. both side by the LCD (x + 2)(x - 1)
*Since x squared CANNOT be negative,
there is no x-intercept
|
This means there is NO x-intercept.
|
y-intercept:
What value are we going to use for x? You are correct if
you said 0.
|
|
*Plug in 0 for x
*y-intercept of -1/2
|
The y-intercept is (0, -1/2)
|
Note how the
vertical asymptotes section the graph into three parts. I’m going
to
plug in two x values that are to the left of x = -2, one in between x = -2 and x = 1,
and two that are to the right of x = 1.
|
Plugging in -4 for x we get:
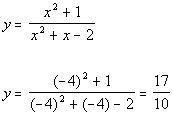 (-4, 17/10)
|
Plugging in -3 for x we get:
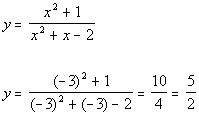 (-3, 5/2)
|
Plugging in -1 for x we get:
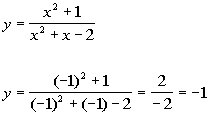 (-1, -1)
|
Plugging in 2 for x we get:
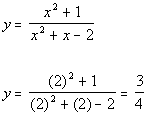 (2, 3/4)
|
Plugging in 3 for x we get:
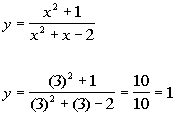 (3, 1)
|
Step 6: Draw
curves through the points, approaching the asymptotes. |
 Example 9 Example 9:
Sketch the graph of the function  .
|
|
*Factor
*Cancel the common factor of x
|
The factor of x canceled out and there were no factors of x left in
the denominator. This means there is an open hole on the graph at x = 0.
x = 0:
|
There is an open hole
at (0, -4/3).
|
Vertical Asymptote:
So now
we want to find where the new
denominator is equal to 0:
|
There is one vertical asymptote: x = -3.
|
Horizontal Asymptote:
Since the degree of the
numerator is one degree higher than the degree of the denominator,
there is a slant asymptote and no horizontal asymptote.
|
Slant Asymptote:
Applying long
division to this problem we get:
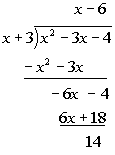
The answer to the long division would be  .
The equation for the slant
asymptote is the quotient part of the answer which would be  .
|
x-intercept:
What value are we going to use for y? You are correct if
you said 0.
|
|
*Plug in 0 for y
*Mult. both side by the LCD (x + 3)
*Factor
*Set 1st factor = 0
*Set 2nd factor = 0
|
There are two x-intercepts: (4, 0) and (-1,
0).
|
y-intercept:
What value are we going to use for x? You are correct if
you said 0.
|
|
*Plug in 0 for x
*y-intercept of -4/3
|
The y-intercept is (0, -4/3).
Note that this will be open hole, as found in step 1.
|
Note how the
vertical asymptote sections the graph into two parts. I’m going
to
plug in two x values that are to the left of x = -3.
|
Plugging in -5 for x we get:
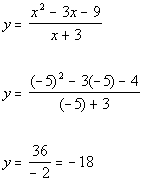 (-5, -18)
|
Plugging in -4 for x we get:
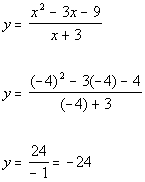 (-4, -24)
|
Step 6: Draw
curves through the points, approaching the asymptotes. |
 Practice Problems Practice Problems
These are practice problems to help bring you to the next level.
It will allow you to check and see if you have an understanding of these
types of problems. Math works just like anything
else, if you want to get good at it, then you need to practice it.
Even the best athletes and musicians had help along the way and lots of
practice, practice, practice, to get good at their sport or instrument.
In fact there is no such thing as too much practice.
To get the most out of these, you should work the problem out on
your own and then check your answer by clicking on the link for the answer/discussion
for that problem. At the link you will find the answer
as well as any steps that went into finding that answer. |
 Practice Problem 1a: Give the domain of the given
function. Practice Problem 1a: Give the domain of the given
function.
 Practice Problems 2a - 2b: Find the vertical and horizontal
asymptotes for the given functions. Practice Problems 2a - 2b: Find the vertical and horizontal
asymptotes for the given functions.
 Practice Problem 3a: Find the oblique asymptote for the
given function. Practice Problem 3a: Find the oblique asymptote for the
given function.
 Practice Problems 4a - 4b: Sketch the graph of the given
function. Practice Problems 4a - 4b: Sketch the graph of the given
function.
 Need Extra Help on these Topics? Need Extra Help on these Topics?

Last revised on March 18, 2011 by Kim Seward.
All contents copyright (C) 2002 - 2011, WTAMU and Kim Seward. All rights reserved.
|
|


