![]()
I used the test-point method, but you could also use the sign graph of factors method.
Ā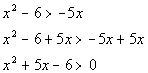
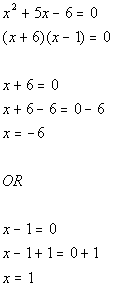
*Set 1st factor = 0 and solve
*Set 2nd factor = 0 and solve
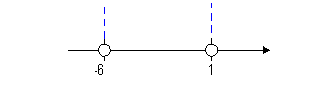
Note that the two boundary points create three sections
on the graph: ![]() ,
, ![]() ,
and
,
and ![]() .
.
Keep in mind that our inequality is ![]() .
Since we are looking for the quadratic expression to be GREATER
THAN 0, that means we need our sign to be POSITIVE.
.
Since we are looking for the quadratic expression to be GREATER
THAN 0, that means we need our sign to be POSITIVE.
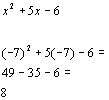
From the interval ![]() ,
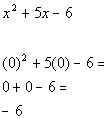
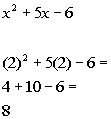
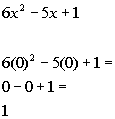
I choose to use -7 to test this interval:
,
I choose to use -7 to test this interval:
(I could have used -10, -25, or -10000 as long as it is in the interval)
Graph:

*Visual showing all numbers
less than -6 or
greater than 1
![]()
I used the test-point method, but you could also use the sign graph of
factors method.
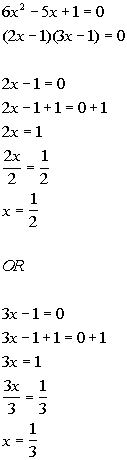
*Set 1st factor = 0 and solve
*Set 2nd factor = 0 and solve
Note that the two boundary points create three sections
on the graph: ![]() ,
, ![]() , and
, and ![]() .
.
Keep in mind that our original problem is ![]() .
Since we are looking for the quadratic expression to be LESS
THAN OR EQUAL TO 0, that means we need our sign to be NEGATIVE
(OR 0).
.
Since we are looking for the quadratic expression to be LESS
THAN OR EQUAL TO 0, that means we need our sign to be NEGATIVE
(OR 0).
From the interval ![]() ,
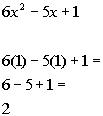
I choose to use 0 to test this interval:
,
I choose to use 0 to test this interval:
(I could have used -10, -25, or -10000 as long as it is in the interval)
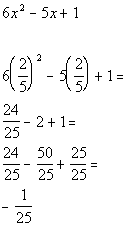
*Chose 2/5 from 2nd interval to
plug in for x
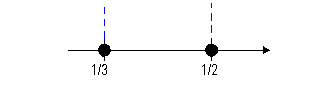
Graph:
![]()
*Visual showing all numbers between 1/3 and 1/2, inclusive
![]()
Last revised on Dec. 30, 2009 by Kim Seward.
All contents copyright (C) 2002 - 2010, WTAMU and Kim Seward.
All rights reserved.