Intermediate Algebra
Answer/Discussion to Practice Problems
Tutorial 12: Graphing Equations
 Answer/Discussion
to 1a Answer/Discussion
to 1a
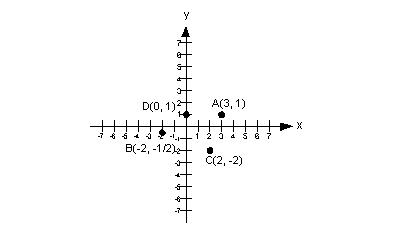
A(3, 1), B(-2, -1/2), C(2, -2), and D(0,1)

A(3, 1) lies in quadrant I.
B(-2, -1/2) lies in quadrant III.
C(2, -2) lies in quadrant IV.
D(0, 1) lies on the y axis.
(return to problem
1a) |
 Answer/Discussion
to 2a
y Answer/Discussion
to 2a
y = 4 x - 10 (0, -10), (1, -14), (-1, -14) |
Let's start with the ordered pair (0, -10).
Which number is the x value and which one
is the y value? If you said x = 0 and y = -10, you are correct!
Let's plug (0, -10) into the equation and see what we get: |
|
*Plug in 0 for x and -10 for y
|
This is a TRUE statement, so (0, -10) is a solution to the equation y = 4x - 10.
Now, let's take a look at (1, -14).
Which number is the x value and which one
is the y value? If you said x = 1 and y = -14, you are right!
Let's plug (1, -14) into the equation and see what we get: |
|
*Plug in 1 for x and -14 for y
|
This is a FALSE statement, so (1, -14) is NOT a solution to the
equation y = 4x - 10.
Now, let's take a look at (-1, -14).
Which number is the x value and which one
is the y value? If you said x = -1 and y = -14, you are right!
Let's plug (-1, -14) into the equation and see what we get: |
|
*Plug in -1 for x and -14 for y
|
 Answer/Discussion
to 3a
y Answer/Discussion
to 3a
y = 2 x - 1 |
If we subtract 2x from both sides, then
we can write the given equation as -2x + y = -1.
Since we can write it in the standard form, Ax + By = C, then we have a linear equation.
This means that we will have a line when we go to graph this. |
|
The three x values I'm going to use are
-1, 0, and 1. (Note that you can pick ANY three x values that
you want. You do not have to use the values that I picked.) You
want to keep it as simple as possible. The following is the chart
I ended up with after plugging in the values I mentioned for x.
|
x
|
y = 2x -
1
|
(x, y)
|
|
-1
|
y = 2(-1) - 1 = -3
|
(-1, -3)
|
|
0
|
y = 2(0) - 1 = -1
|
(0, -1)
|
|
1
|
y = 2(1) - 1 = 1
|
(1, 1)
|
|
 Answer/Discussion
to 3b Answer/Discussion
to 3b
 |
If we add x squared to both sides
we would end up with  .
Is this a linear equation? Note how we have an x squared
as opposed to x to the one power.
It looks like we cannot write it in the form Ax + By = C, because the x has to be to the one power, not squared. So this is not a linear
equation.
However, we can still graph it. |
|
The seven x values that I'm going to use are -3, -2, -1, 0, 1, 2, and
3. (Note that you can pick ANY x values
that you want. You do not have to use the values that I picked.) You
want to keep it as simple as possible. The following is the chart
I ended up with after plugging in the values I mentioned for x.
|
x
|

|
(x, y)
|
|
-3
|
y = -(-3)^2 = -9
|
(-3, -9)
|
|
-2
|
y = -(-2)^2 = -4
|
(-2, -4)
|
|
-1
|
y = -(-1)^2 = -1
|
(-1, -1)
|
|
0
|
y = -(0)^2 = 0
|
(0, 0)
|
|
1
|
y = -(1)^2 = -1
|
(1, -1)
|
|
2
|
y = -(2)^2 = -4
|
(2, -4)
|
|
3
|
y = -(3)^2 = -9
|
(3, -9)
|
|
 Answer/Discussion
to 3c Answer/Discussion
to 3c
 |
Do you think this equation is linear or not? It is a tricky problem,
because both the x and y variables are to the one power. However, x is inside the absolute value sign and we can't just take it out of there.
In other words, we can't write it in the form Ax +
By = C. This means that this equation
is not a linear equation. |
|
The seven x values that I'm going to use are -3, -2, -1, 0, 1, 2, and
3. (Note that you can pick ANY x values
that you want. You do not have to use the values that I picked.) You
want to keep it as simple as possible. The following is the chart
I ended up with after plugging in the values I mentioned for x.
|
x
|

|
(x, y)
|
|
-3
|
y = |-3| - 1 = 2
|
(-3, 2)
|
|
-2
|
y = |-2| - 1 = 1
|
(-2, 1)
|
|
-1
|
y = |-1| - 1 = 0
|
(-1, 0)
|
|
0
|
y = |0| - 1 = -1
|
(0, -1)
|
|
1
|
y = |1| - 1 = 0
|
(1, 0)
|
|
2
|
y = |2| - 1 = 1
|
(2, 1)
|
|
3
|
y = |3| - 1 = 2
|
(3, 2)
|
|

Last revised on July 3, 2011 by Kim Seward.
All contents copyright (C) 2001 - 2011, WTAMU and Kim Seward.
All rights reserved.
|
|


