College Algebra
Answer/Discussion to Practice Problems
Tutorial 22: Linear Inequalities
WTAMU > Virtual Math Lab > College Algebra > Tutorial 22: Linear Inequalities
 Answer/Discussion
to 1a Answer/Discussion
to 1a

|
|
Interval notation:
Graph:
 |
*Inv. of add. 2 is sub. 2
*Inv. of mult. by -5 is div. both sides by
-5, so reverse inequality sign
*Open interval indicating all values greater
than -2
*Visual showing all numbers greater than -2
on the number line
|
Interval notation:
We have an open interval since we are not including where it is equal
to -2. x is greater than -2, so
-2 is our smallest value of the interval so it goes on the left.
Since there is no upper endpoint (it is ALL values greater than -2), we
put the infinity symbol on the right side. The curved end on -2 indicates
an open interval. Infinity always has a curved end because there
is not an endpoint on that side. Graph:
We use the same type of notation on the endpoint as we did in the interval
notation, a curved end. Since we needed to indicate all values
greater than -2, the part of the number line that was to the right of -2
was darkened. |
 Answer/Discussion
to 1b Answer/Discussion
to 1b

|
|
Interval notation:
Graph:
 |
*Distributive property
*Get x terms on
one side, constants on the other side
*Inv. of add. 9 is sub. by 9
*Closed interval indicating all values less
than or = to -4
*Visual showing all numbers less than or =
to -4 on the number line
|
Interval notation:
We have a closed interval since we are including where it is equal
to -4. This time x is less
than or equal to -4, so -4 is our largest value of the interval so it goes
on the right. Since there is no lower endpoint (it is ALL values
less than or equal to -4), we put the negative infinity symbol on the left
side. The boxed end on -4 indicates a closed interval. Negative
infinity always has a curved end because there is not an endpoint on that
side. Graph:
Again, we use the same type of notation on the endpoint as we did in
the interval notation, a boxed end. Since we needed to indicate all
values less than or equal to -4, the part of the number line that was to
the left of -4 was darkened. |
 Answer/Discussion
to 1c Answer/Discussion
to 1c

|
|
Interval notation:
Graph:
 |
*Mult. both sides by LCD of 5
*Get x terms on
one side, constants on the other side
*Inv. of add. 2 is sub. by 2
*Inv. of mult. by -2 is div. both sides by
-2, so reverse inequality sign
*Closed interval indicating all values greater
than or equal to 7/2
*Visual showing all numbers greater than or
equal to 7/2 on the number line
|
Interval notation:
This time we have a closed interval since we are including where it
is equal to 7/2. x is greater than
or equal to 7/2, so 7/2 is our smallest value of the interval so it goes
on the left. Since there is no upper endpoint (it is ALL values greater
than or equal to 7/2), we put the infinity symbol on the right side.
The boxed end on 7/2 indicates a closed interval. Infinity always
has a curved end because there is not an endpoint on that side. Graph:
Again, we use the same type of notation on the endpoint as we did in
the interval notation, a boxed end this time. Since we needed
to indicate all values greater than or equal to 7/2, the part of the number
line that was to the right of 7/2 was darkened. |
 Answer/Discussion
to 2a Answer/Discussion
to 2a

|
The absolute value expression is already isolated. |
The distance that the expression 2y + 5 is away from the origin needs to be greater than or equal to 1.

All numbers that are less than -1 OR greater than 1 are greater than
1 unit away from the origin. So the expression 2y + 5 needs to be less than -1 OR greater than 1. |
|
OR

Interval notation:
Graph:
 |
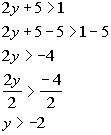
*First inequality, where it is less than -1
*Inv. of add. 5 is sub. 5
*Inv. of mult. by 2 is div. by 2
*Second inequality, where it is greater than
1
*Inv. of add. 5 is sub. 5
*Inv. of mult. by 2 is div. by 2
*All values less than -3 or greater than -2
*Visual showing all numbers less than -3 or
greater than -2
|
Interval notation:
This time we have two open intervals since we are not including the
endpoints -3 and -2.
In the first interval, y is less than -3,
so -3 is our largest value of the interval so it goes on the right.
Since there is no lower endpoint of that first interval, we put negative
infinity on the left side. The curved end on -3 indicates an open
interval. Infinity always has a curved end because there is not an
endpoint on that side.
In the second interval, y is greater
than -2, so -2 is our smallest value of the interval so it goes on the
left. Since there is no upper endpoint of that second interval, we
put the infinity symbol on the right side. The curved end on -2 indicates
an open interval. Infinity always has a curved end because there
is not an endpoint on that side.
Graph:
Again, we use the same type of notation on the endpoints as we did
in the interval notation, a curved end on both y = -3 and y = -2. Since we needed to indicate
all values less than -3 OR greater than -2, the parts of the number line
that are to the left of -3 and to the right of -2 were darkened. |
 Answer/Discussion
to 2b Answer/Discussion
to 2b

|
|
*Inv. of add. 7 is sub. 7
*Abs. value exp. isolated |
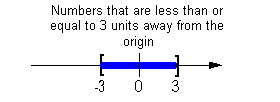
The distance that the expression 3y - 2 is away from the origin needs to be less than 3.

All numbers between -3 and 3 are less than 3 units away from the origin.
So, the expression 3y - 2 needs to be between
-3 and 3. |
|
Interval notation:
Graph:
 |
*Inv. of sub. 2 is add. 2
*Apply steps to all three parts
*Inv. of mult. by 3 is div by 3
*Apply steps to all three parts
*Closed interval indicating all values between
-1/3 and 5/3, inclusive
*Visual showing all numbers between -1/3 and
5/3, inclusive
|
Interval notation:
This time we have a closed interval since we are including both endpoints. y is between -1/3 and 5/3, inclusive, so -1/3 is our smallest
value of the interval so it goes on the left and 5/3 goes on the right.
The boxed end on both numbers indicate a closed interval on both sides.
Graph:
Again, we use the same type of notation on the endpoints as we did
in the interval notation, a boxed end on both ends. Since we
needed to indicate all values between -1/3 and 5/3, the part of the
number line that is in between -1/3 and 5/3 was darkened. |
 Answer/Discussion
to 2c Answer/Discussion
to 2c

|
The absolute value expression is already isolated. |
Again, be careful - since the absolute value (the left side) is always
positive, and positive values are always greater than negative values, the
answer is all real numbers. No matter what value you plug in
for x, when you take the absolute value the
left side will be positive. All positive numbers are greater than
-5. |
 Answer/Discussion
to 2d Answer/Discussion
to 2d

|
The absolute value expression is already isolated. |
Be careful, since the absolute value (the left side) is always positive,
and positive values are always greater than negative values, the answer
is no solution. There is no value that we can put in for x that would make this inequality true. |

Last revised on Dec. 29, 2009 by Kim Seward.
All contents copyright (C) 2002 - 2010, WTAMU and Kim Seward.
All rights reserved.
|
|


