College Algebra
Answer/Discussion to Practice Problems
Tutorial 31: Graphs of Functions, Part I:
Graping Functions by Plotting Points
 Answer/Discussion
to 1a Answer/Discussion
to 1a
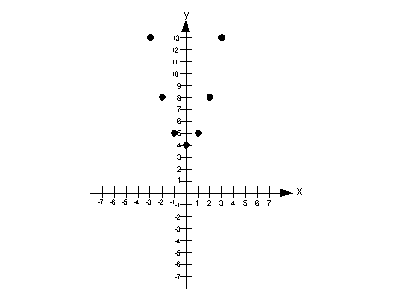
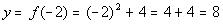
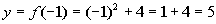
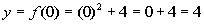
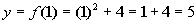
 ; x = -3, -2, -1, 0, 1, 2, 3 ; x = -3, -2, -1, 0, 1, 2, 3
|
Step 1: Find at
least four ordered pair solutions. |
I'm going to use a chart to organize my information. A chart
keeps track of the x values that you are using
and the corresponding y value found when you
used a particular x value.
We will use the seven values of x that were
given to find corresponding functional values to give us seven ordered
pair solutions.
Keep in mind that the functional value that we find correlates to the
second or y value of our ordered pair. |
|
x
|
|
(x, y)
|
|
-3
|
|
(-3, 13)
|
|
-2
|
|
(-2, 8)
|
|
-1
|
|
(-1, 5)
|
|
0
|
|
(0, 4)
|
|
1
|
|
(1, 5)
|
|
2
|
|
(2, 8)
|
|
3
|
|
(3, 13)
|
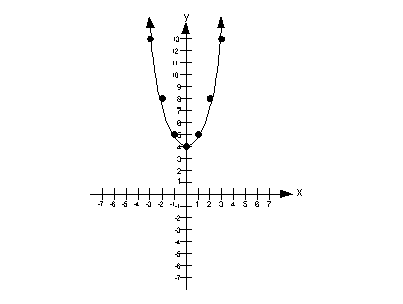
Step 2: Plot the
points found in step 1. |
Domain
We need to find the set of all input values.
In terms of ordered pairs, that correlates with the first component of
each one. In terms of this two dimensional graph, that corresponds
with the x values (horizontal axis).
Since that is the case, we need to look to the
left and right and see if there are any end points. In
this case, note how the curve has arrows at both
ends, that means it would go on and on forever to the right and to the
left.
This means that the domain is  . . |
Range
We need to find the set of all output values.
In terms of ordered pairs, that correlates with the second component of
each one. In terms of this two dimensional graph, that corresponds with
the y values (vertical axis).
Since that is the case, we need to look up and
down and see if there are any end points. In this case, note
how the curve has a low endpoint of y = 4 and
it has arrows at both ends going up, that means it would go up on and on
forever.
This means that the range is  . . |
Answer/Discussion
to 1b
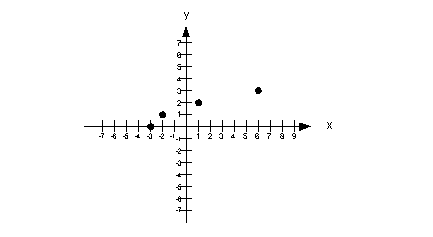
 ; x = -3, -2, 1, 6 ; x = -3, -2, 1, 6
|
Step 1: Find at
least four ordered pair solutions. |
I'm going to use a chart to organize my information. A chart
keeps track of the x values that you are using
and the corresponding y value found when you
used a particular x value.
We will use the four values of x that were
given to find corresponding functional values to give us four ordered pair
solutions.
Keep in mind that the functional value that we find correlates to the
second or y value of our ordered pair. |
|
x
|
|
(x, y)
|
|
-3
|
|
(-3, 0)
|
|
-2
|
|
(-2, 1)
|
|
1
|
|
(1, 2)
|
|
6
|
|
(6, 3)
|
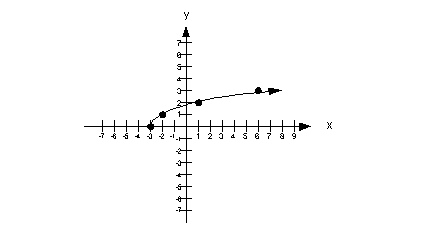
Step 2: Plot the
points found in step 1. |
Domain
We need to find the set of all input values.
In terms of ordered pairs, that correlates with the first component of
each one. In terms of this two dimensional graph, that corresponds
with the x values (horizontal axis).
Since that is the case, we need to look to the
left and right and see if there are any end points. In
this case, note how there is a left endpoint
at x = -3. Also note that the curve has
an arrow going to the right, that means it would go on and on forever
to the right.
This means that the domain is  . . |
Range
We need to find the set of all output values.
In terms of ordered pairs, that correlates with the
second component of each one. In terms of this
two dimensional graph, that corresponds with the y
values (vertical axis).
Since that is the case, we need to look up and
down and see if there are any end points. In this case, note
how the curve has a low endpoint of y = 3 and
it has an arrow going up, that means it would go on and on forever
up.
This means that the range is  . . |
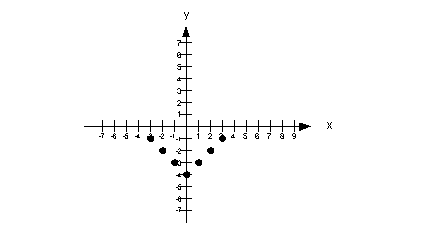
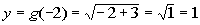
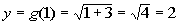
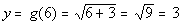
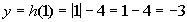
Answer/Discussion
to 1c
 ; x = -3, -2, -1, 0, 1, 2, 3 ; x = -3, -2, -1, 0, 1, 2, 3
|
Step 1: Find at
least four ordered pair solutions. |
I'm going to use a chart to organize my information. A chart
keeps track of the x values that you are using
and the corresponding y value found when you
used a particular x value.
We will use the seven values of x that were
given to find corresponding functional values to give us seven ordered
pair solutions.
Keep in mind that the functional value that we find correlates to the
second or y value of our ordered pair. |
|
x
|
|
(x, y)
|
|
-3
|
|
(-3, -1)
|
|
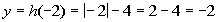
-2
|
|
(-2, -2)
|
|
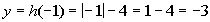
-1
|
|
(-1, -3)
|
|
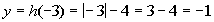
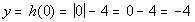
0
|
|
(0, - 4)
|
|
1
|
|
(1, -3)
|
|
2
|
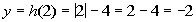
|
(2, -2)
|
|
3
|
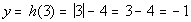
|
(3, -1)
|
Step 2: Plot the
points found in step 1. |
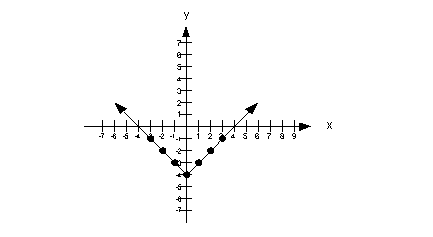
Domain
We need to find the set of all input values.
In terms of ordered pairs, that correlates with the first component of
each one. In terms of this two dimensional graph, that corresponds
with the x values (horizontal axis).
Since that is the case, we need to look to the
left and right and see if there are any end points. In
this case, note how there are arrows at both
ends, that means it would go on and on forever to the right and to the
left.
This means that the domain is . |
Range
We need to find the set of all output values.
In terms of ordered pairs, that correlates with the
second component of each one. In terms of this
two dimensional graph, that corresponds with the y
values (vertical axis).
Since that is the case, we need to look up and
down and see if there are any end points. In this case, note
how the graph has a low endpoint of y = -4
and it has an arrows that go up, that means it would go up on and on forever.
This means that the range is  . . |
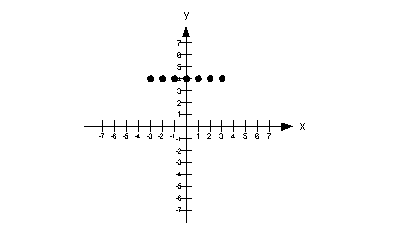
Answer/Discussion
to 1d
 ; x = -3, -2, -1, 0, 1, 2, 3 ; x = -3, -2, -1, 0, 1, 2, 3
|
Step 1: Find at
least four ordered pair solutions. |
I'm going to use a chart to organize my information. A chart
keeps track of the x values that you are using
and the corresponding y value found when you
used a particular x value.
We will use the seven values of x that were
given to find corresponding functional values to give us seven ordered
pair solutions.
Keep in mind that the functional value that we find correlates to the
second or y value of our ordered pair. |
|
x
|

|
(x, y)
|
|
-3
|

|
(-3, 4)
|
|
-2
|

|
(-2, 4)
|
|
-1
|

|
(-1, 4)
|
|
0
|

|
(0, 4)
|
|
1
|

|
(1, 4)
|
|
2
|

|
(2, 4)
|
|
3
|

|
(3, 4)
|
Step 2: Plot the
points found in step 1. |
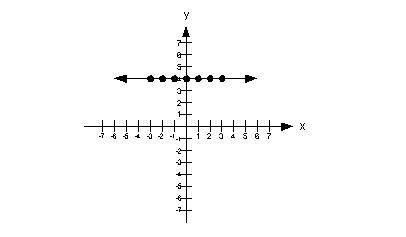
Domain
We need to find the set of all input values.
In terms of ordered pairs, that correlates with the first component of
each one. In terms of this two dimensional graph, that corresponds
with the x values (horizontal axis).
Since that is the case, we need to look to the
left and right and see if there are any end points. In
this case, note how the curve has arrows at both
ends, that means it would go on and on forever to the right and to the
left.
This means that the domain is . |
Range
We need to find the set of all output values.
In terms of ordered pairs, that correlates with the
second component of each one. In terms of this
two dimensional graph, that corresponds with the y values (vertical axis).
Since that is the case, we need to look up and
down and see if there are any end points. In this case, note
how the line does not go up or down and that all the values of y are 4.
This means that the range is {y | y = 4}. |
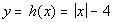
Answer/Discussion
to 1e
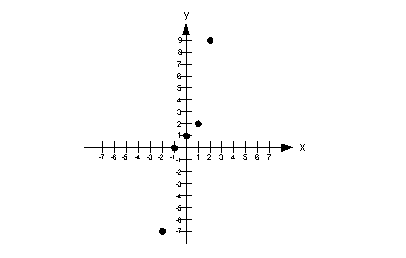
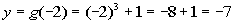
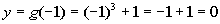
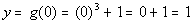
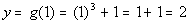
 ; x = -2, -1, 0, 1, 2 ; x = -2, -1, 0, 1, 2
|
Step 1: Find at
least four ordered pair solutions. |
I'm going to use a chart to organize my information. A chart
keeps track of the x values that you are using
and the corresponding y value found when you
used a particular x value.
We will use the five values of x that were
given to find corresponding functional values to give us five ordered pair
solutions.
Keep in mind that the functional value that we find correlates to the
second or y value of our ordered pair. |
|
x
|
|
(x, y)
|
|
-2
|
|
(-2, -7)
|
|
-1
|
|
(-1, 0)
|
|
0
|
|
(0, 1)
|
|
1
|
|
(1, 2)
|
|
2
|
|
(2, 9)
|
Step 2: Plot the
points found in step 1. |
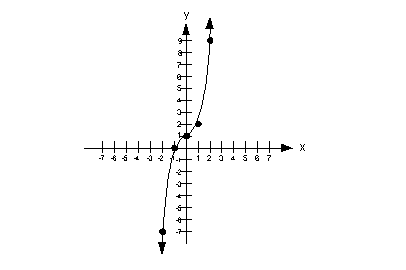
Domain
We need to find the set of all input values.
In terms of ordered pairs, that correlates with the first component of
each one. In terms of this two dimensional graph, that corresponds
with the x values (horizontal axis).
Since that is the case, we need to look to the
left and right and see if there are any end points. In
this case, note how the curve has arrows at both
ends, that means it would go on and on forever to the right and to the
left.
This means that the domain is . |
Range
We need to find the set of all output values.
In terms of ordered pairs, that correlates with the
second component of each one. In terms of this
two dimensional graph, that corresponds with the y values (vertical axis).
Since that is the case, we need to look up and
down and see if there are any end points. In this case, note how the curve
has arrows at both ends, that means it would go on and on forever up and
down.
This means that the range is. |

Last revised on April 7, 2010 by Kim Seward.
All contents copyright (C) 2002 - 2010, WTAMU and Kim Seward. All rights reserved.
|
|